Stats don't tell the story. They just start it.
TeamMetrics is here to help you tell it — with better visuals to evaluate, adjust, and understand what your team is doing, and how well they're doing it.
TeamMetrics is built for coaches and teams who want faster stat entry during the game, and real visuals to understand it after.
Stats don't tell the story. They just start it.
TeamMetrics is here to help you tell it — with better visuals to evaluate, adjust, and understand what your team is doing, and how well they're doing it.
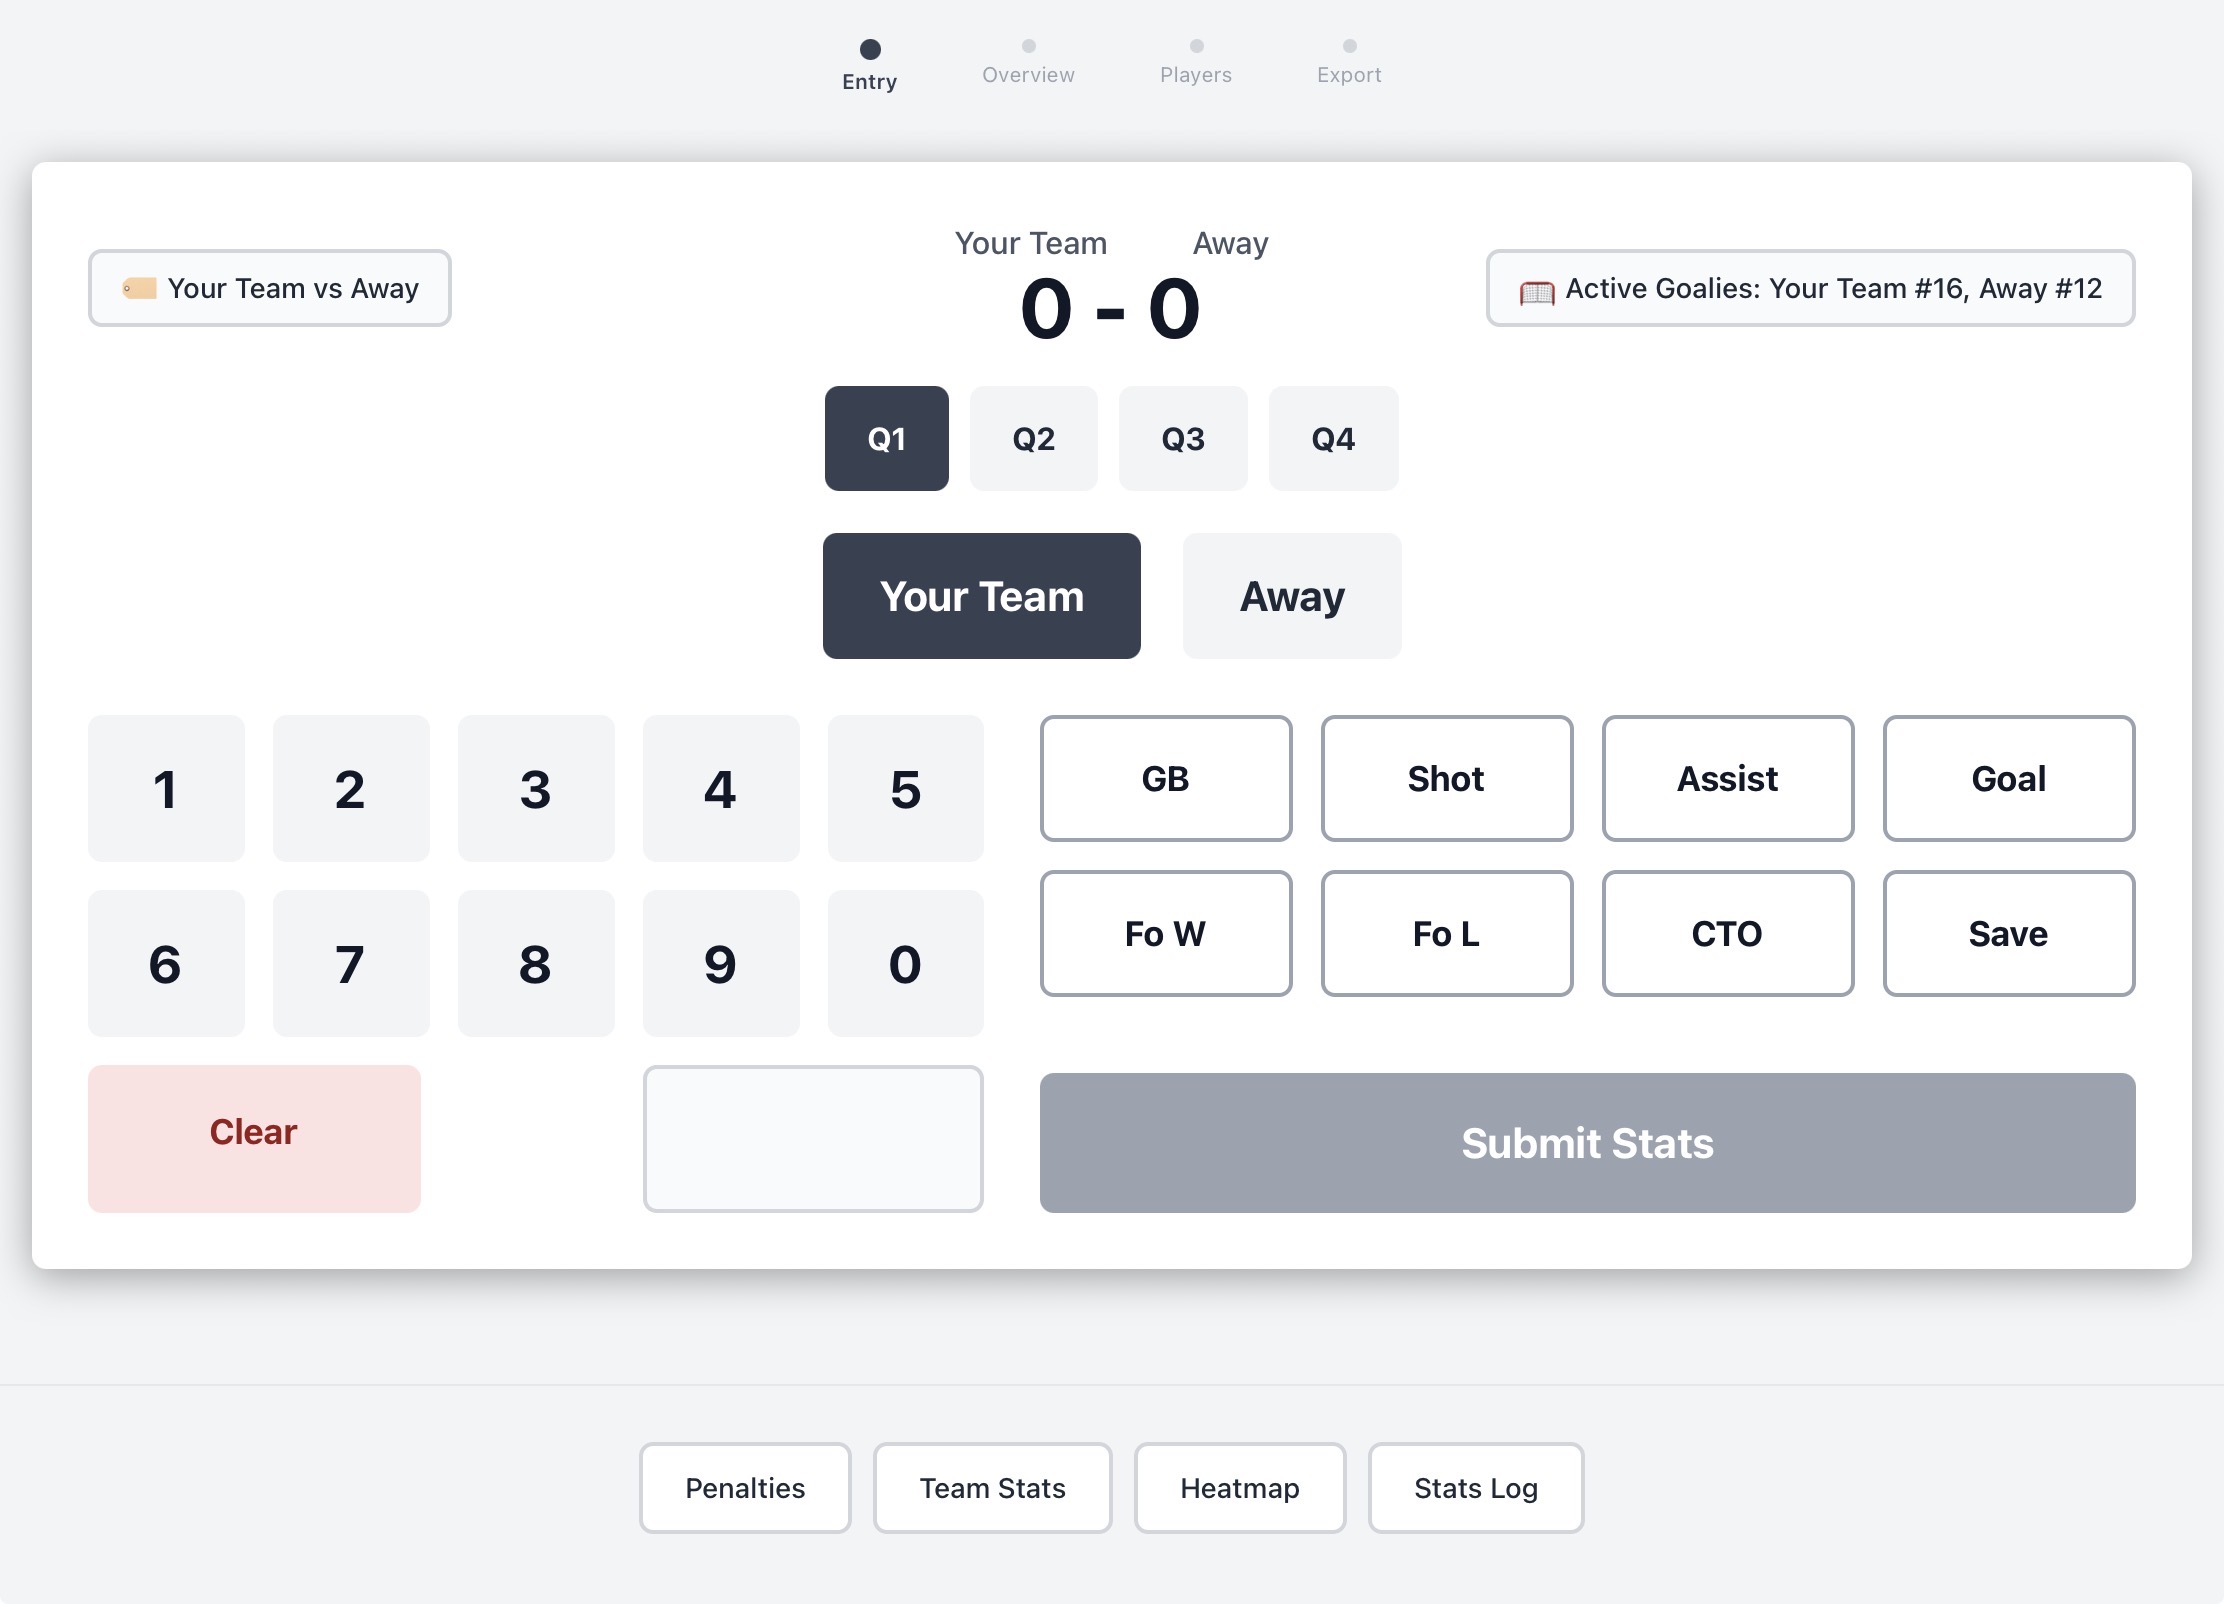
No more searching for a line on a paper stat sheet and writing it down. Track every play in seconds, right from the sideline.
Shots, goals, assists, ground balls, faceoffs, saves, penalties — entered in a tap or two, quarter by quarter, for both teams. Built for the pace of a real game, not a clipboard.
Start a game, enter your team and opponent, and you're tracking in seconds.
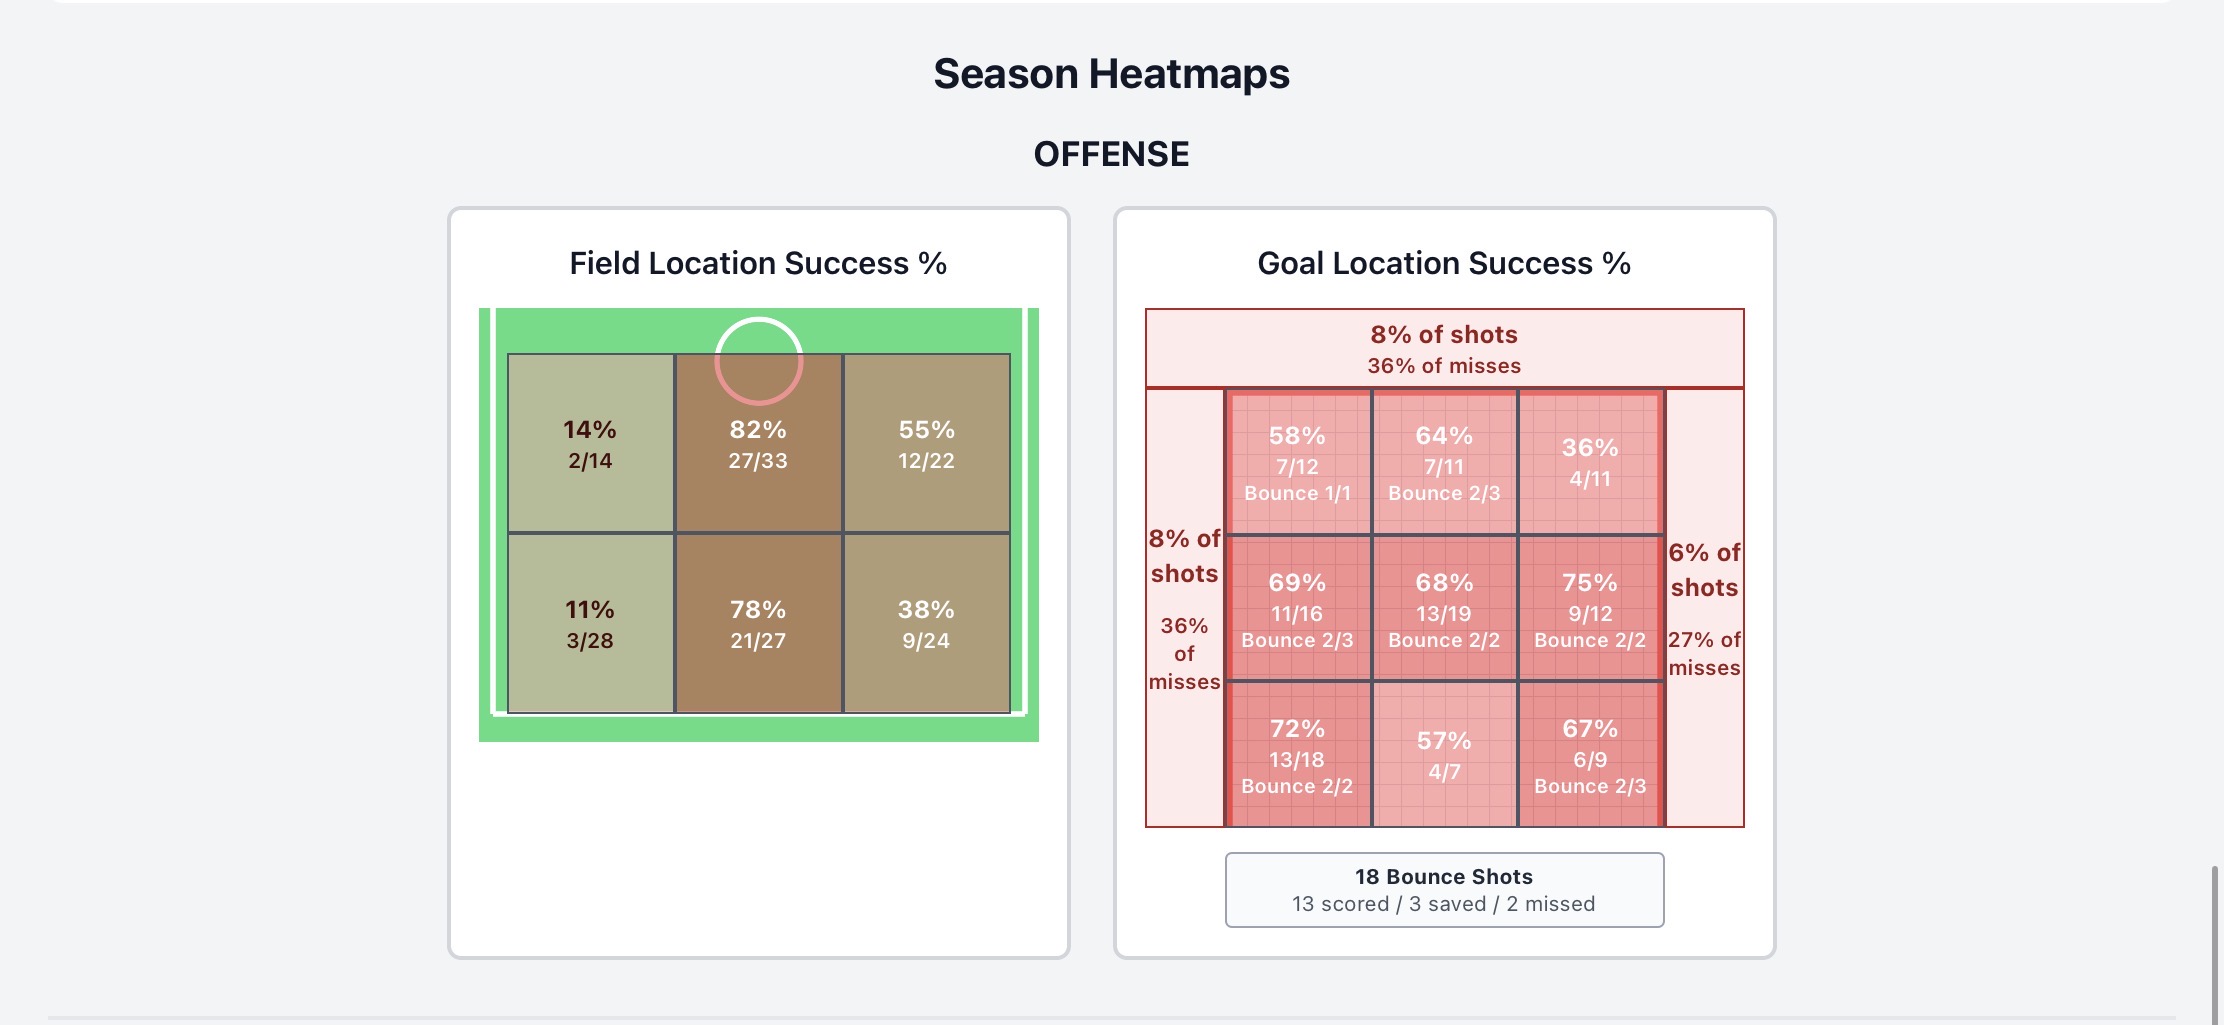
Shot-by-shot, zone-by-zone breakdowns for both offense and defense — where your team is scoring, where shots are missing, and where the other team is getting stopped.
Switch between percentage breakdowns and exact shot locations, for either team, in one tap.
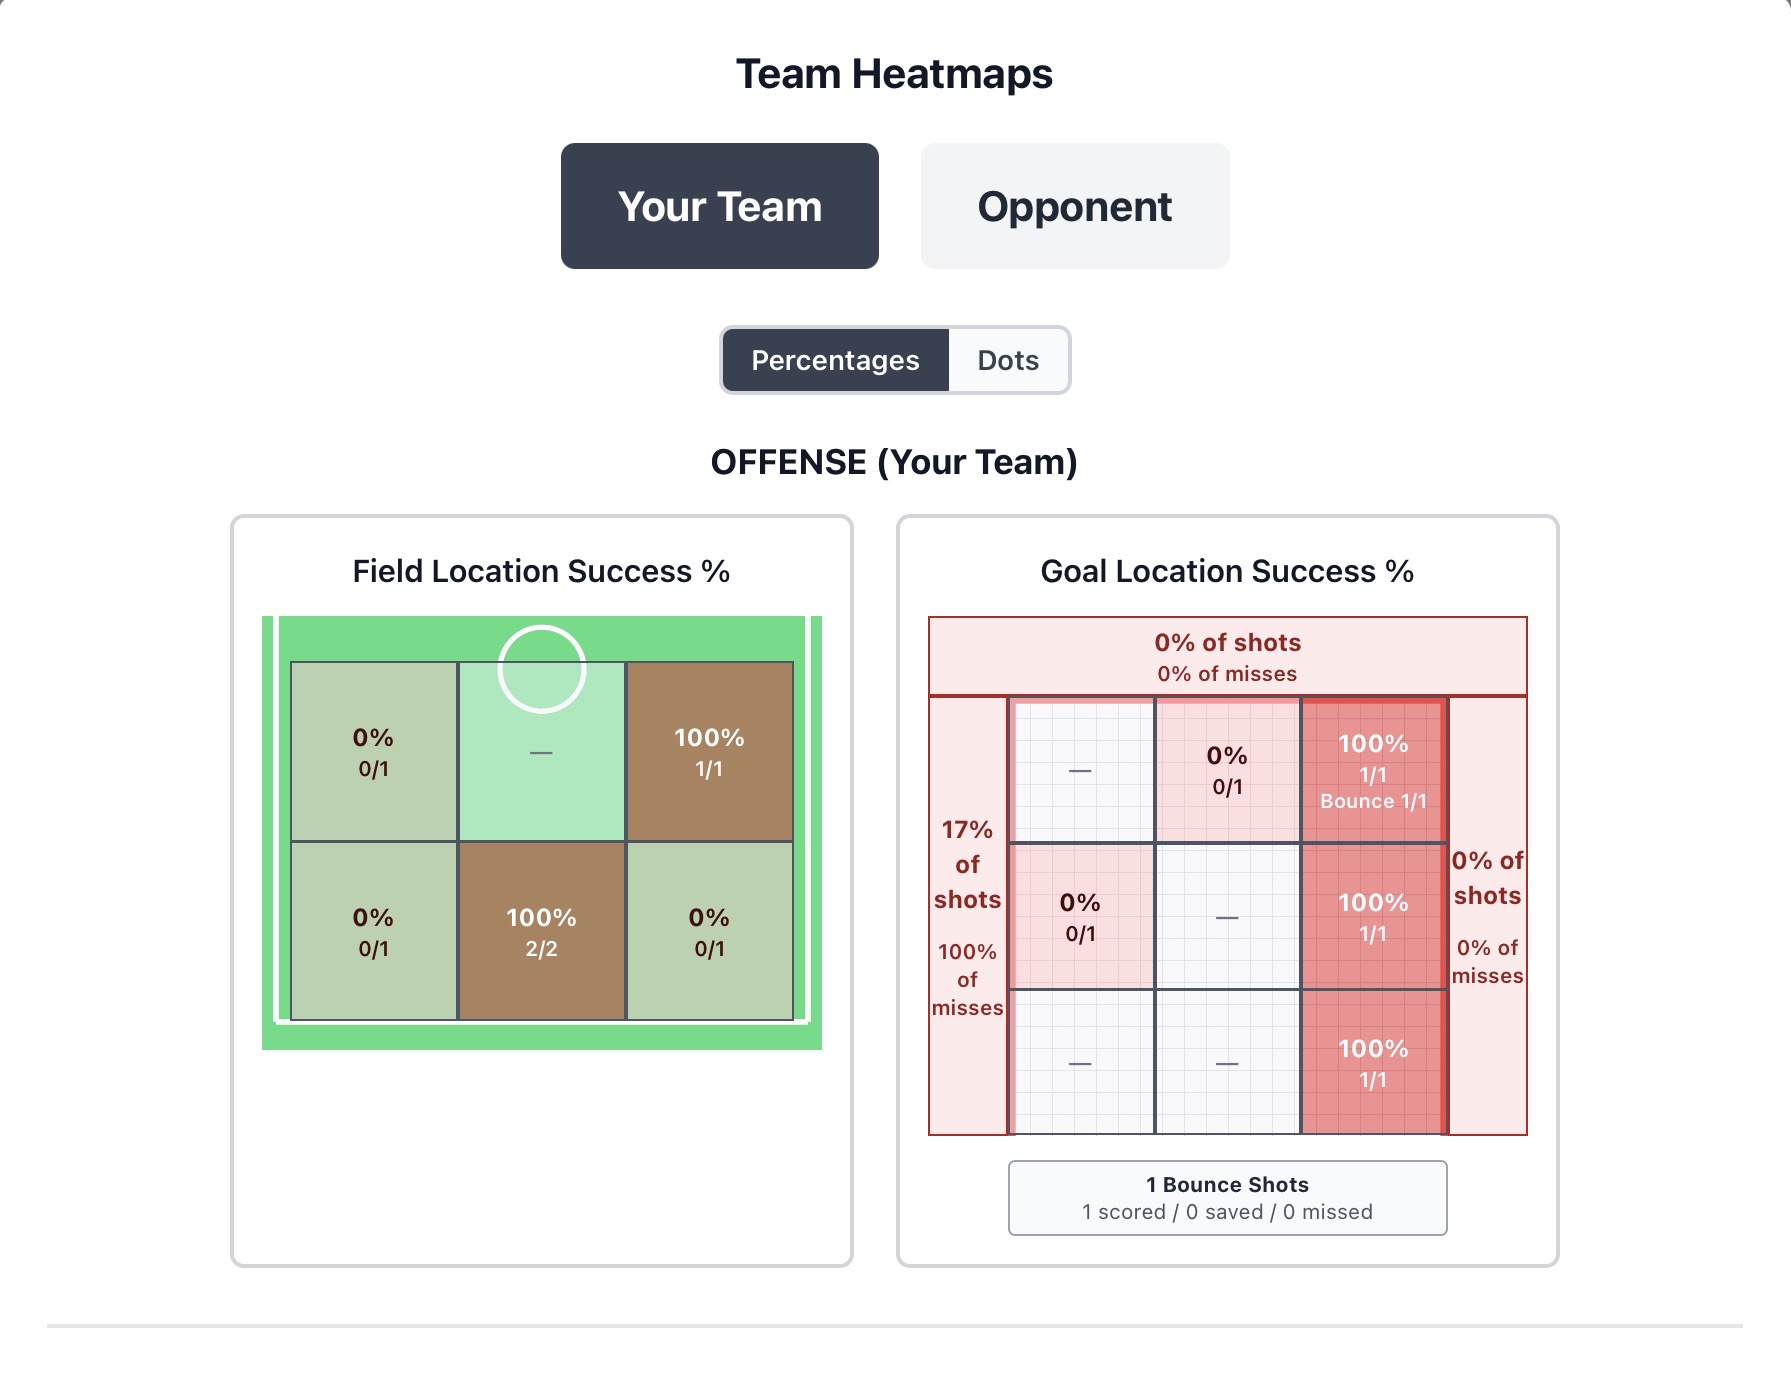
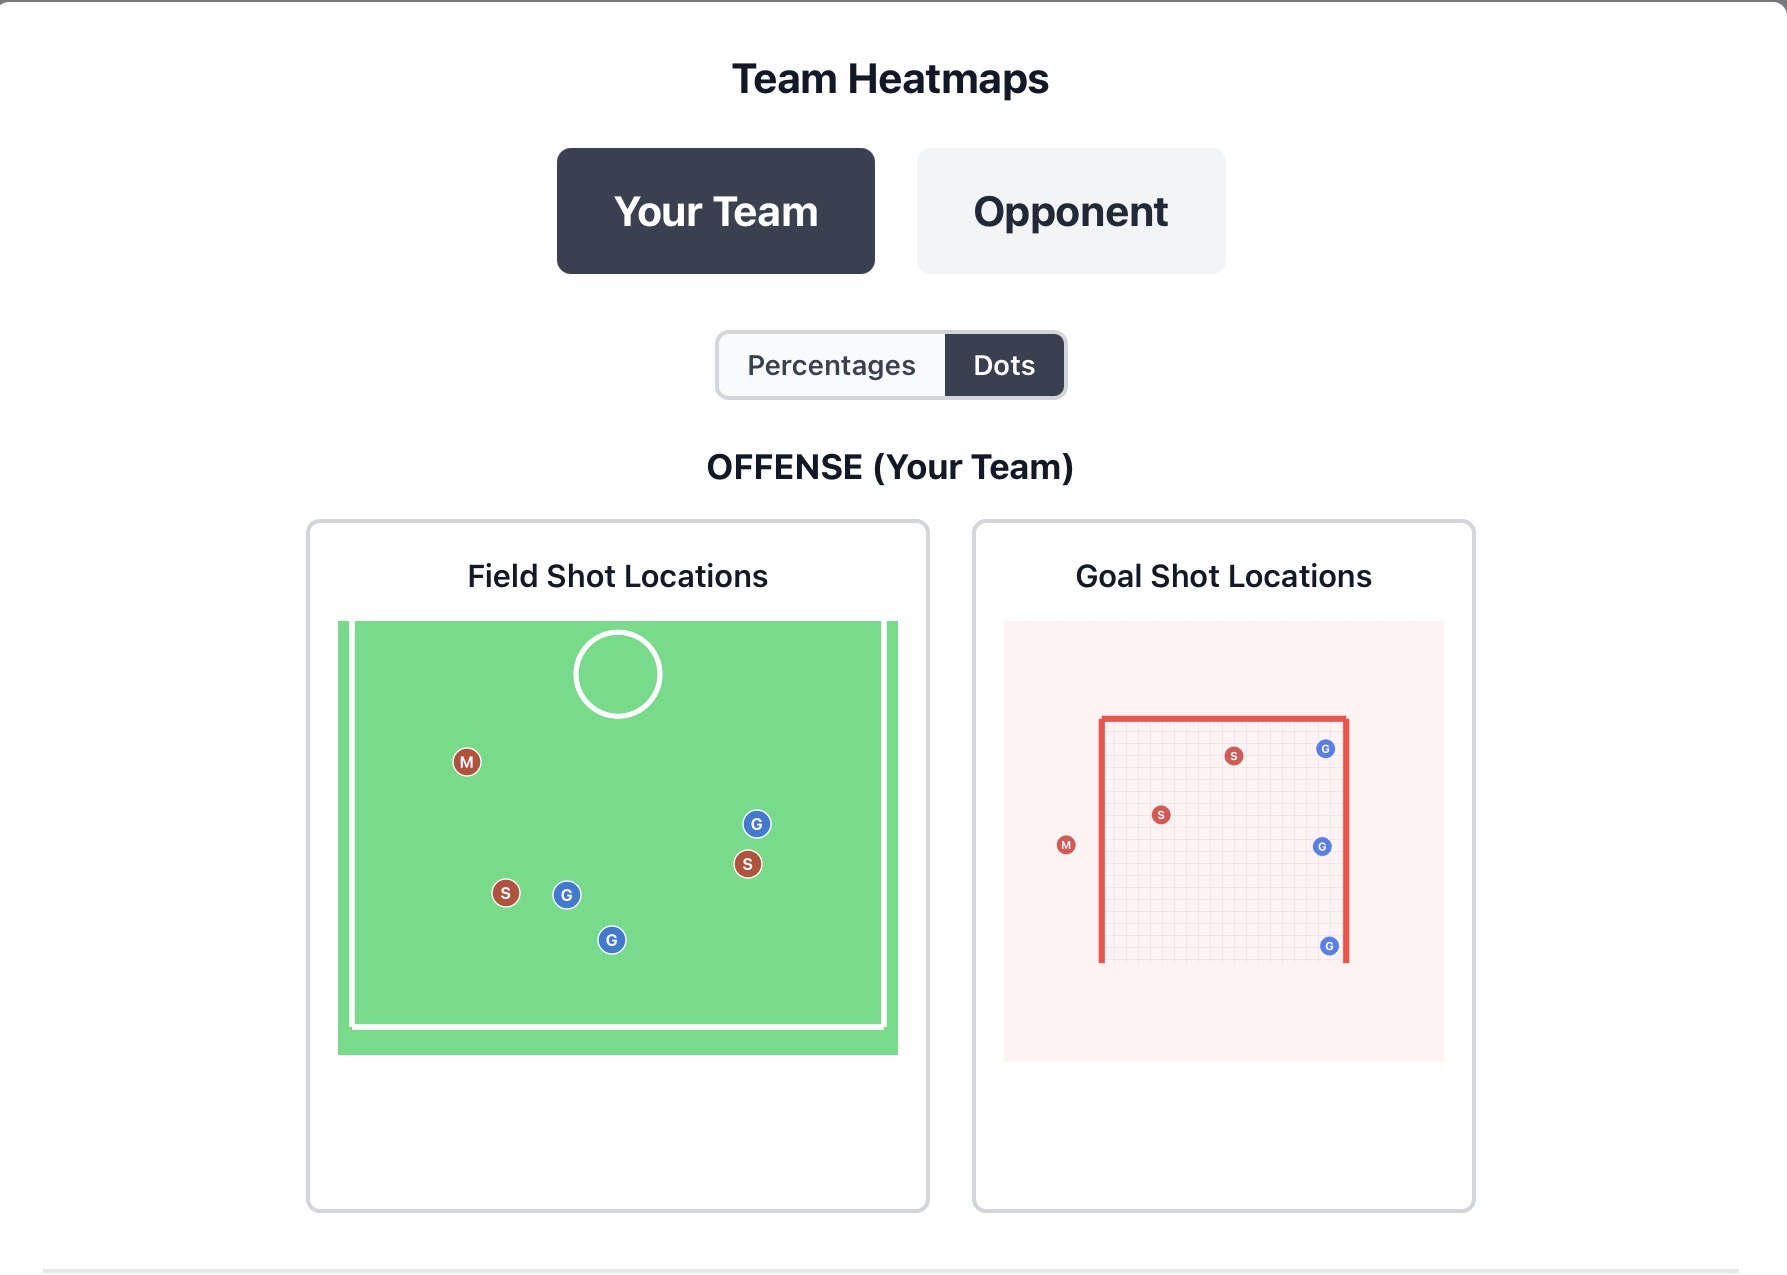
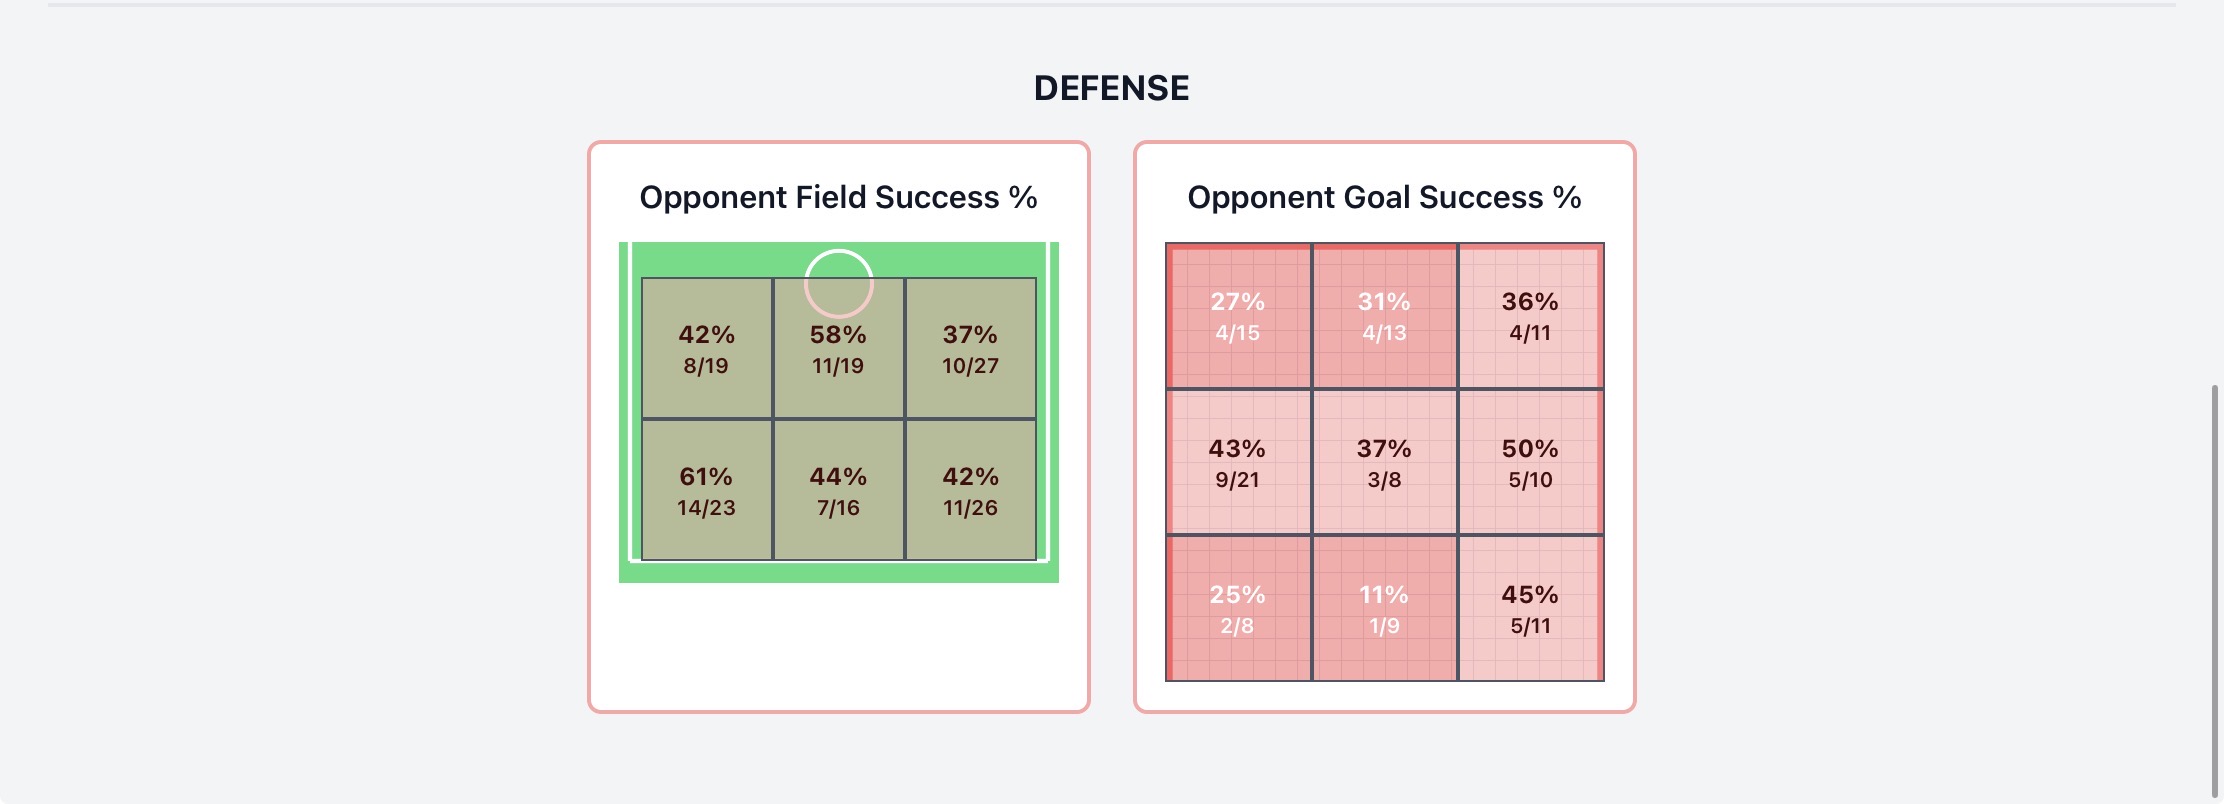
The same zone-by-zone visuals, flipped to show what the opponent did against you — so you can see where your defense is holding up, and where it isn't.
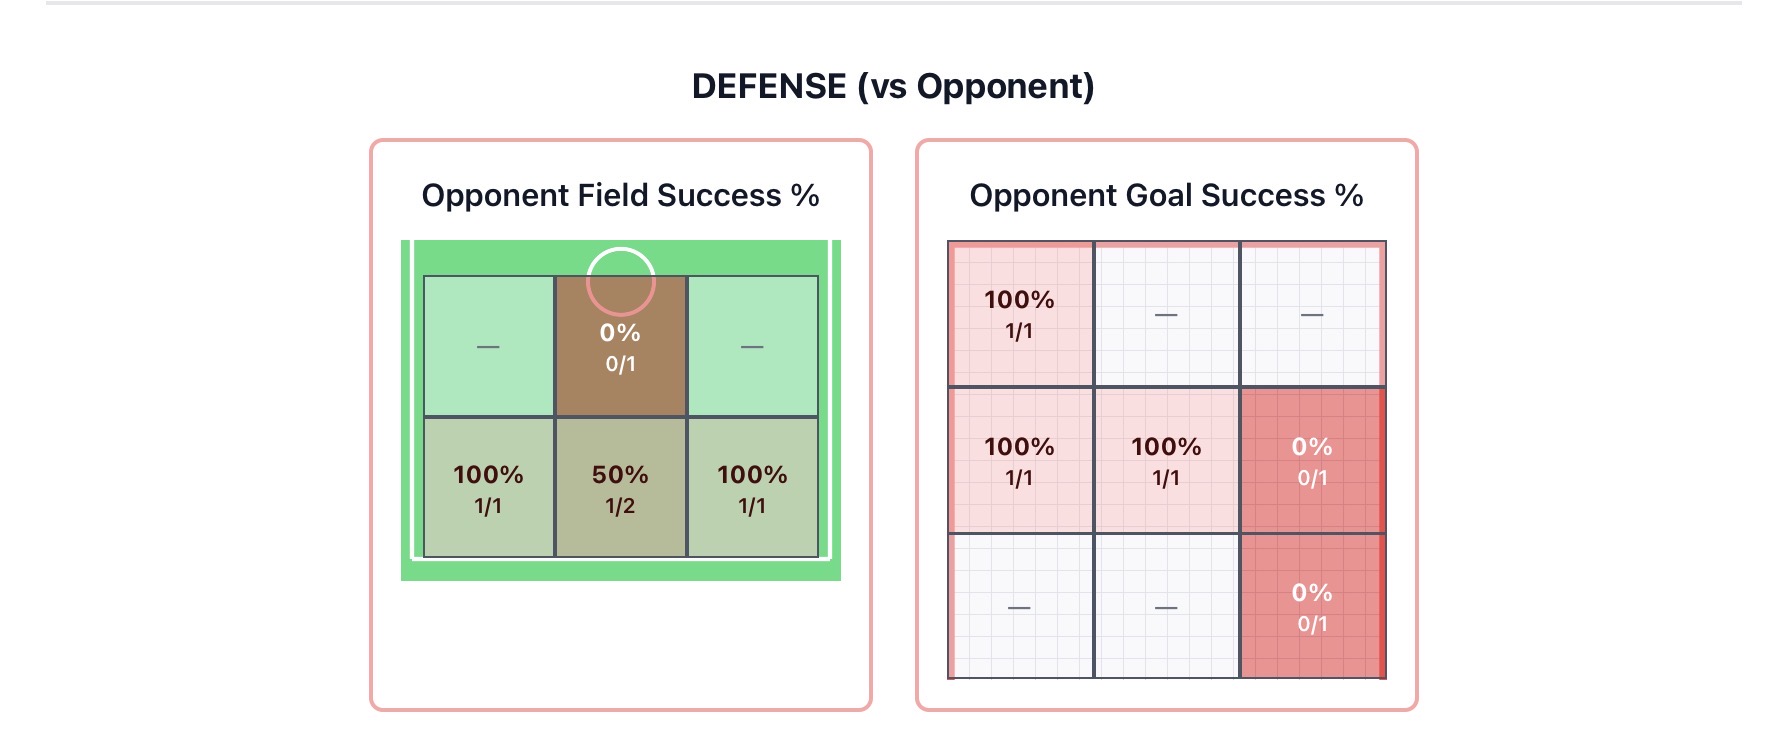
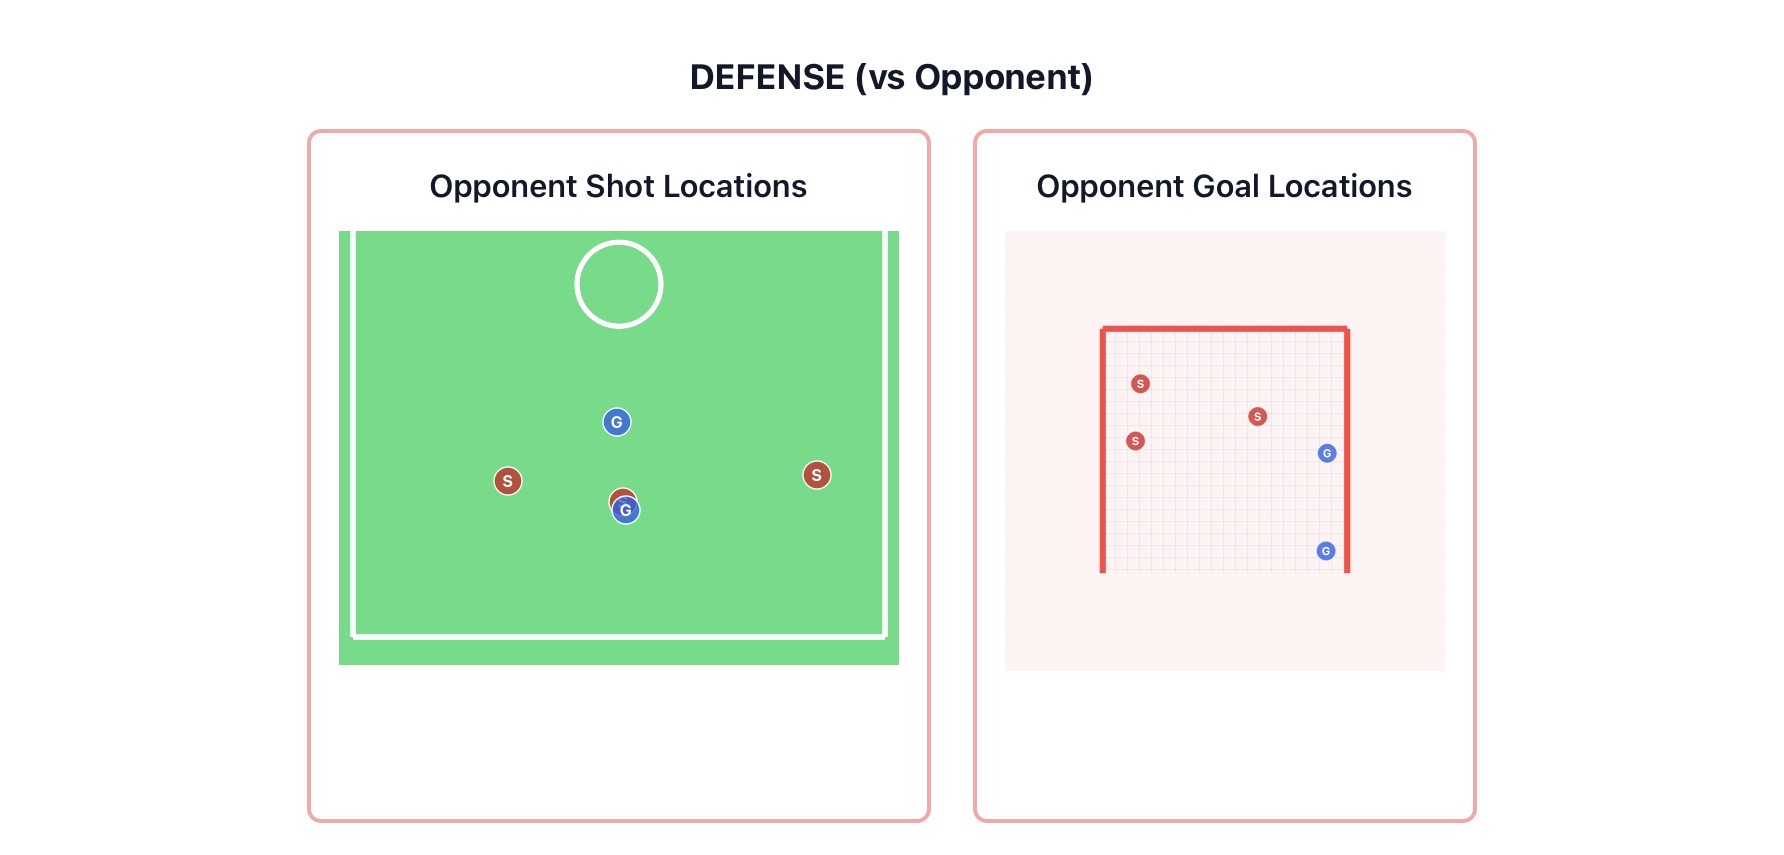
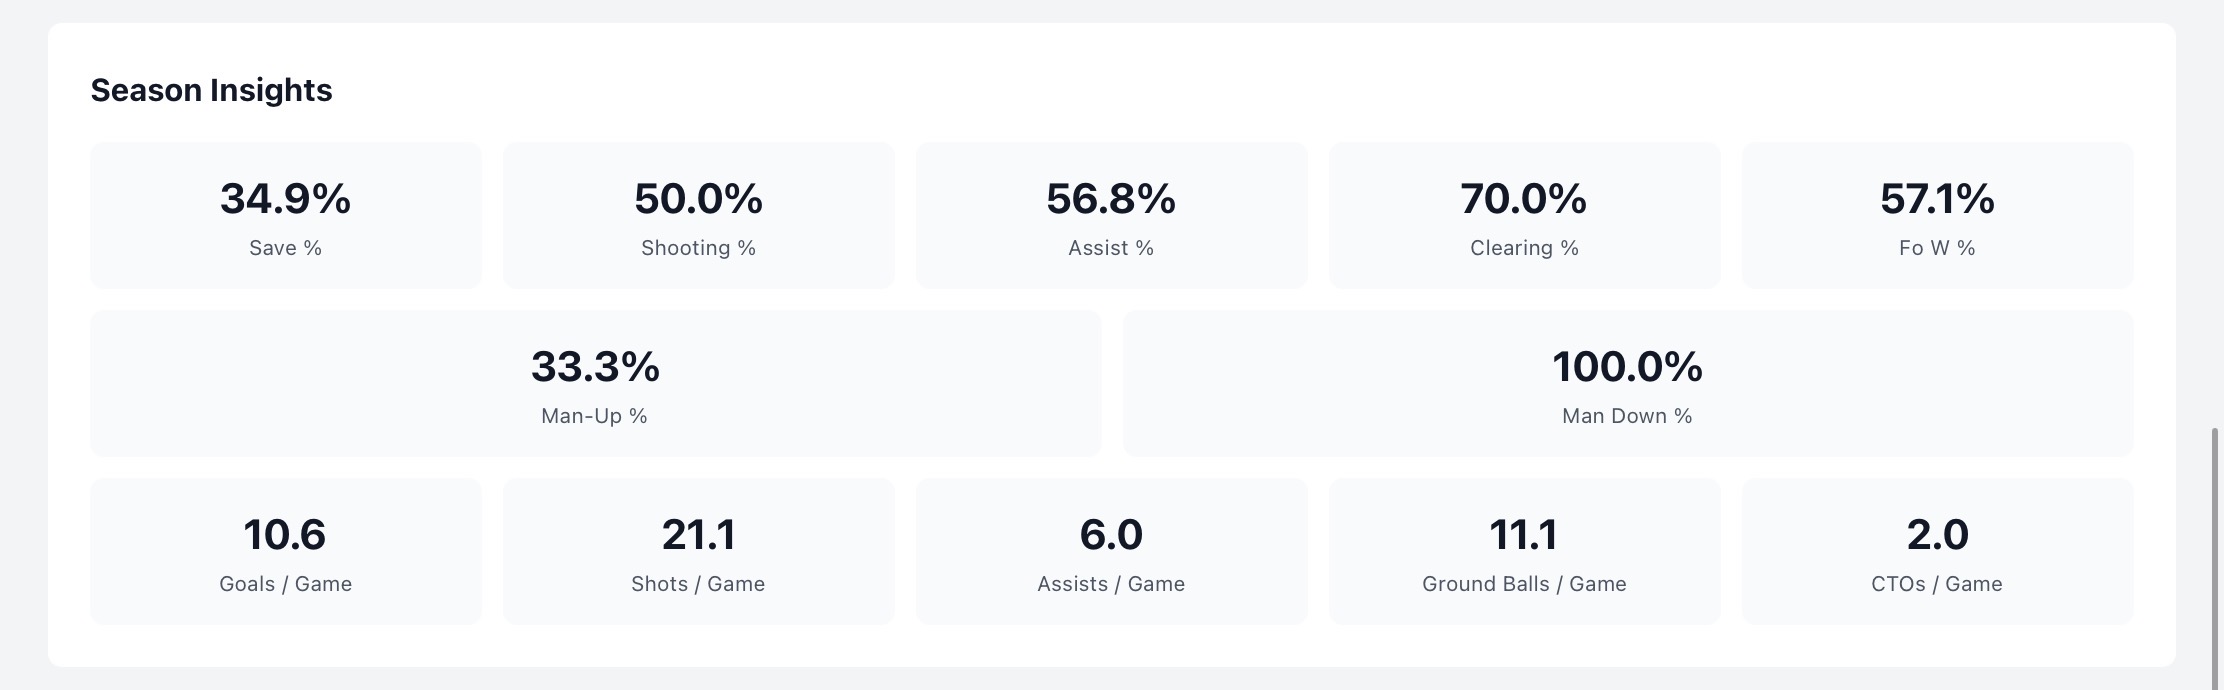
Every game you track adds to the picture — trends, problems, and the things your team is doing well all start showing up on their own, no extra work required.
Save %, shooting %, clearing %, man-up and man-down % — and the per-game averages behind them — update automatically with every game you log, so the trends, problems, and real wins show up on their own instead of needing a deep dive to find.
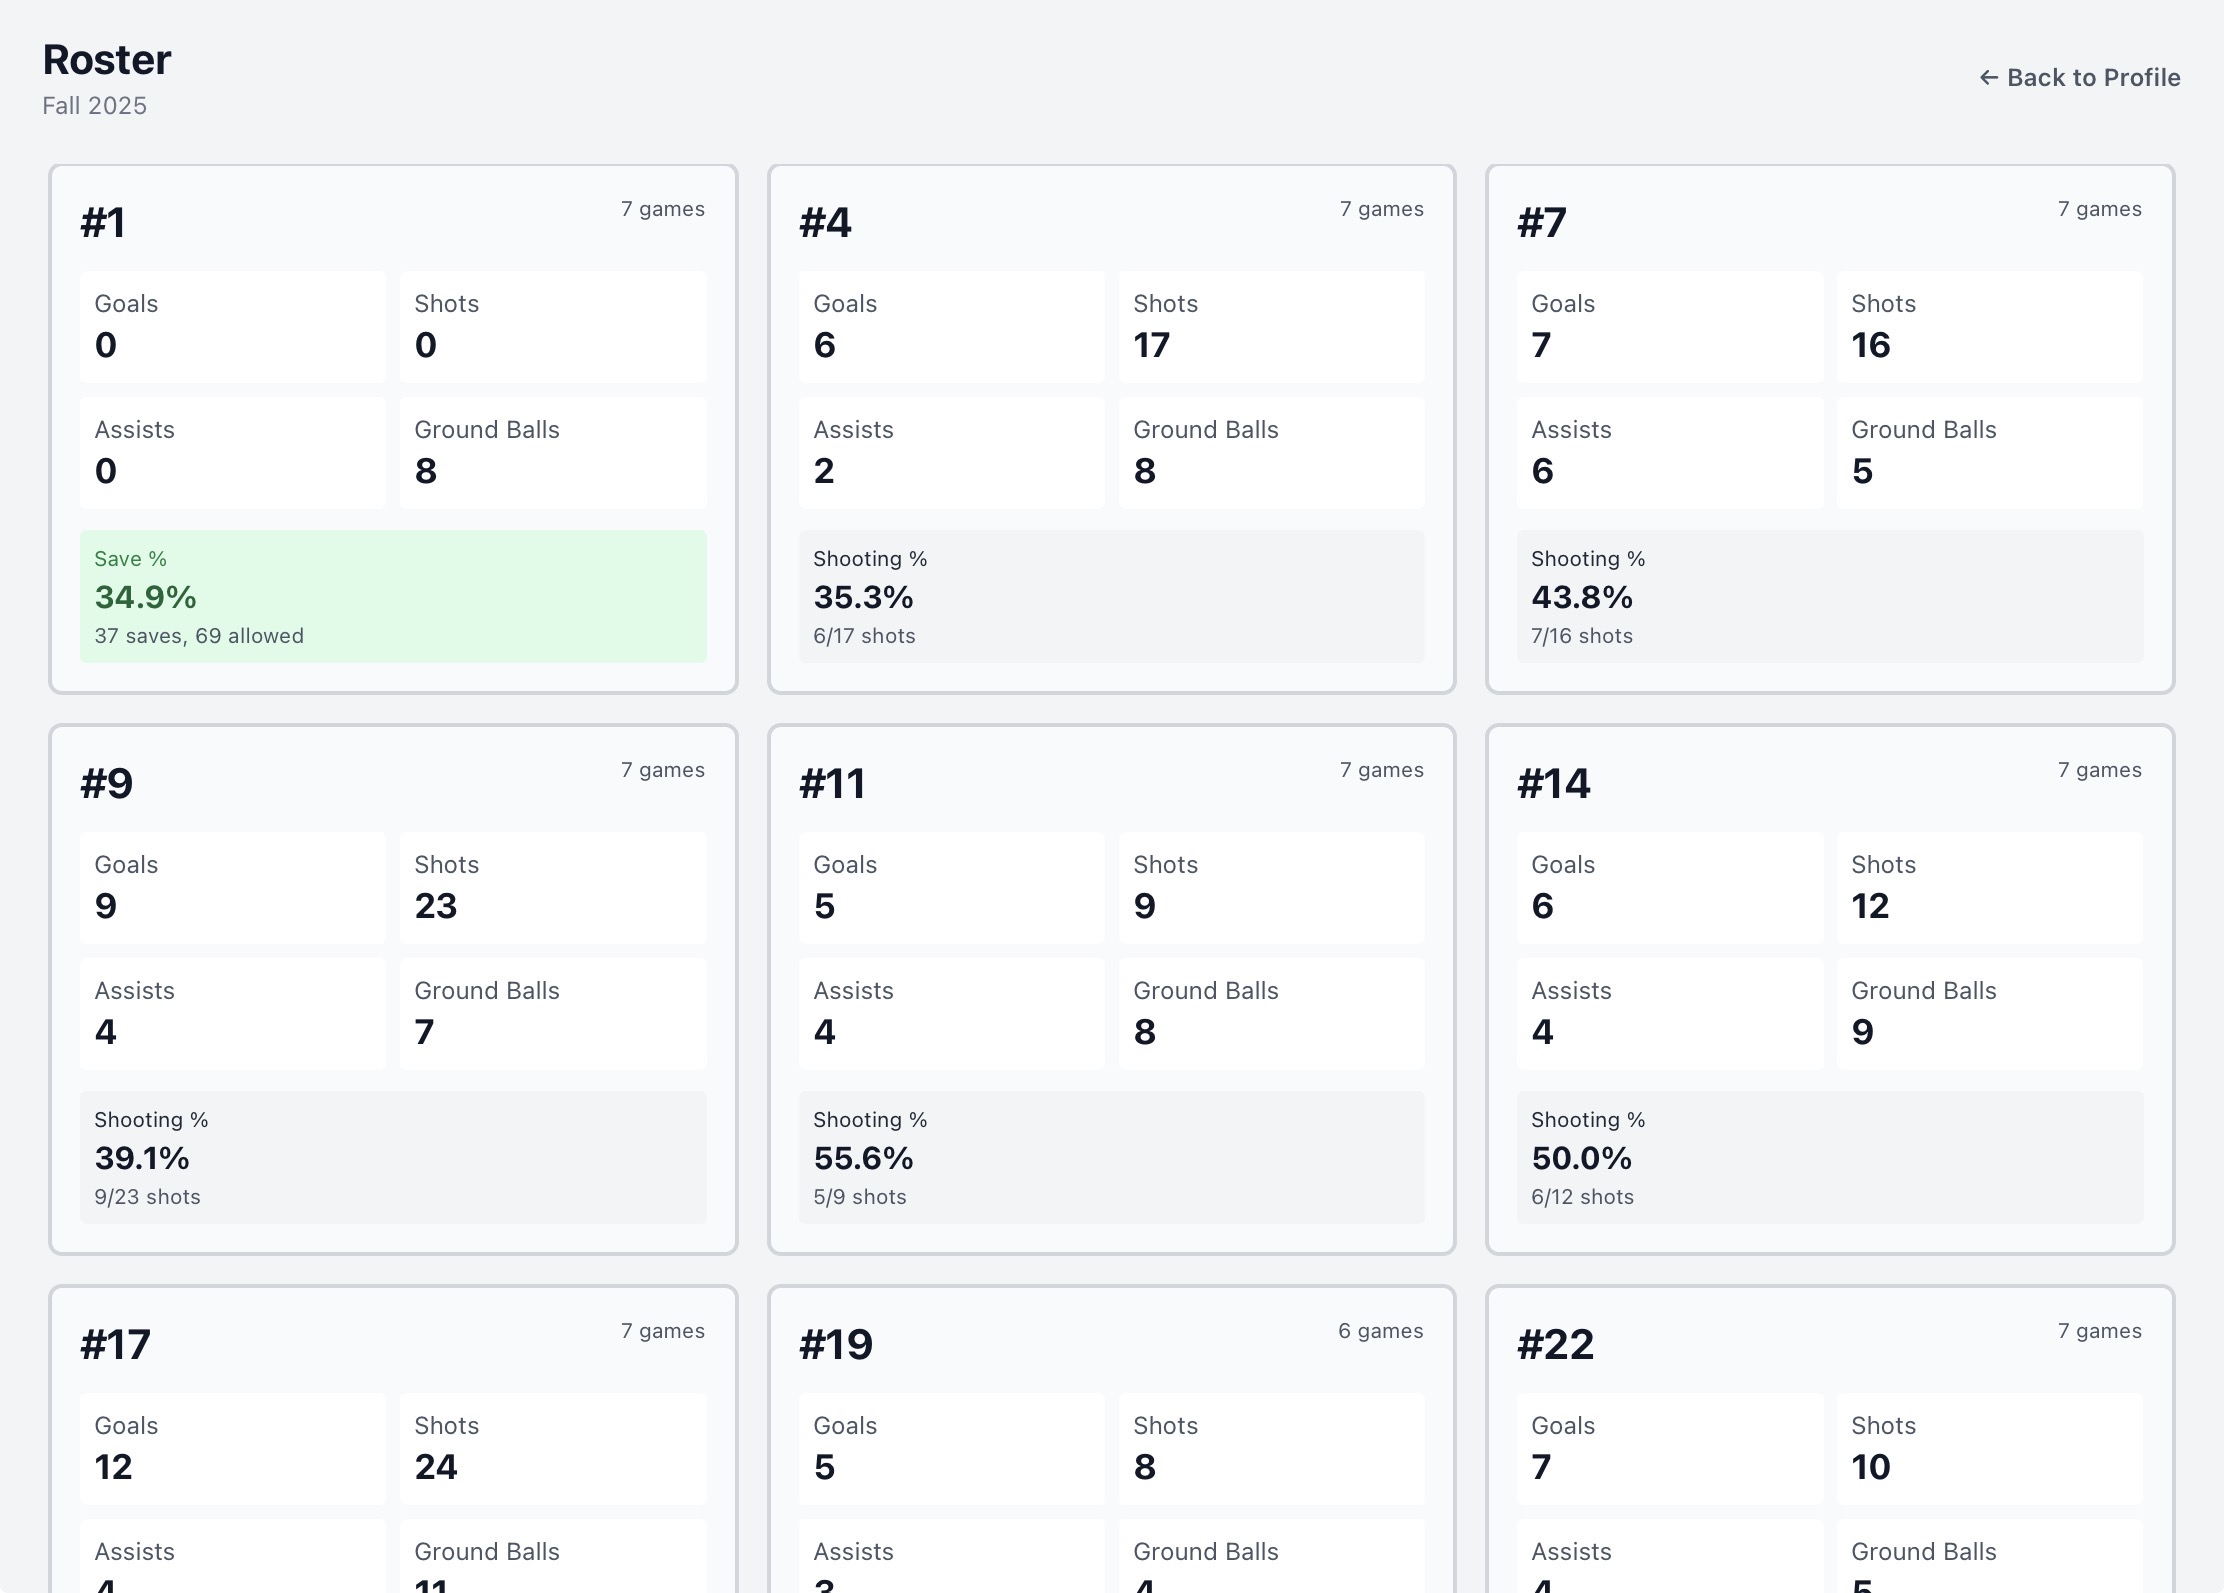
No roster to set up ahead of time — the moment a player shows up in a game, their card appears with season totals that keep growing. Tap into any player for their own shooting breakdown and heatmaps, just like a single game, but for the whole season.
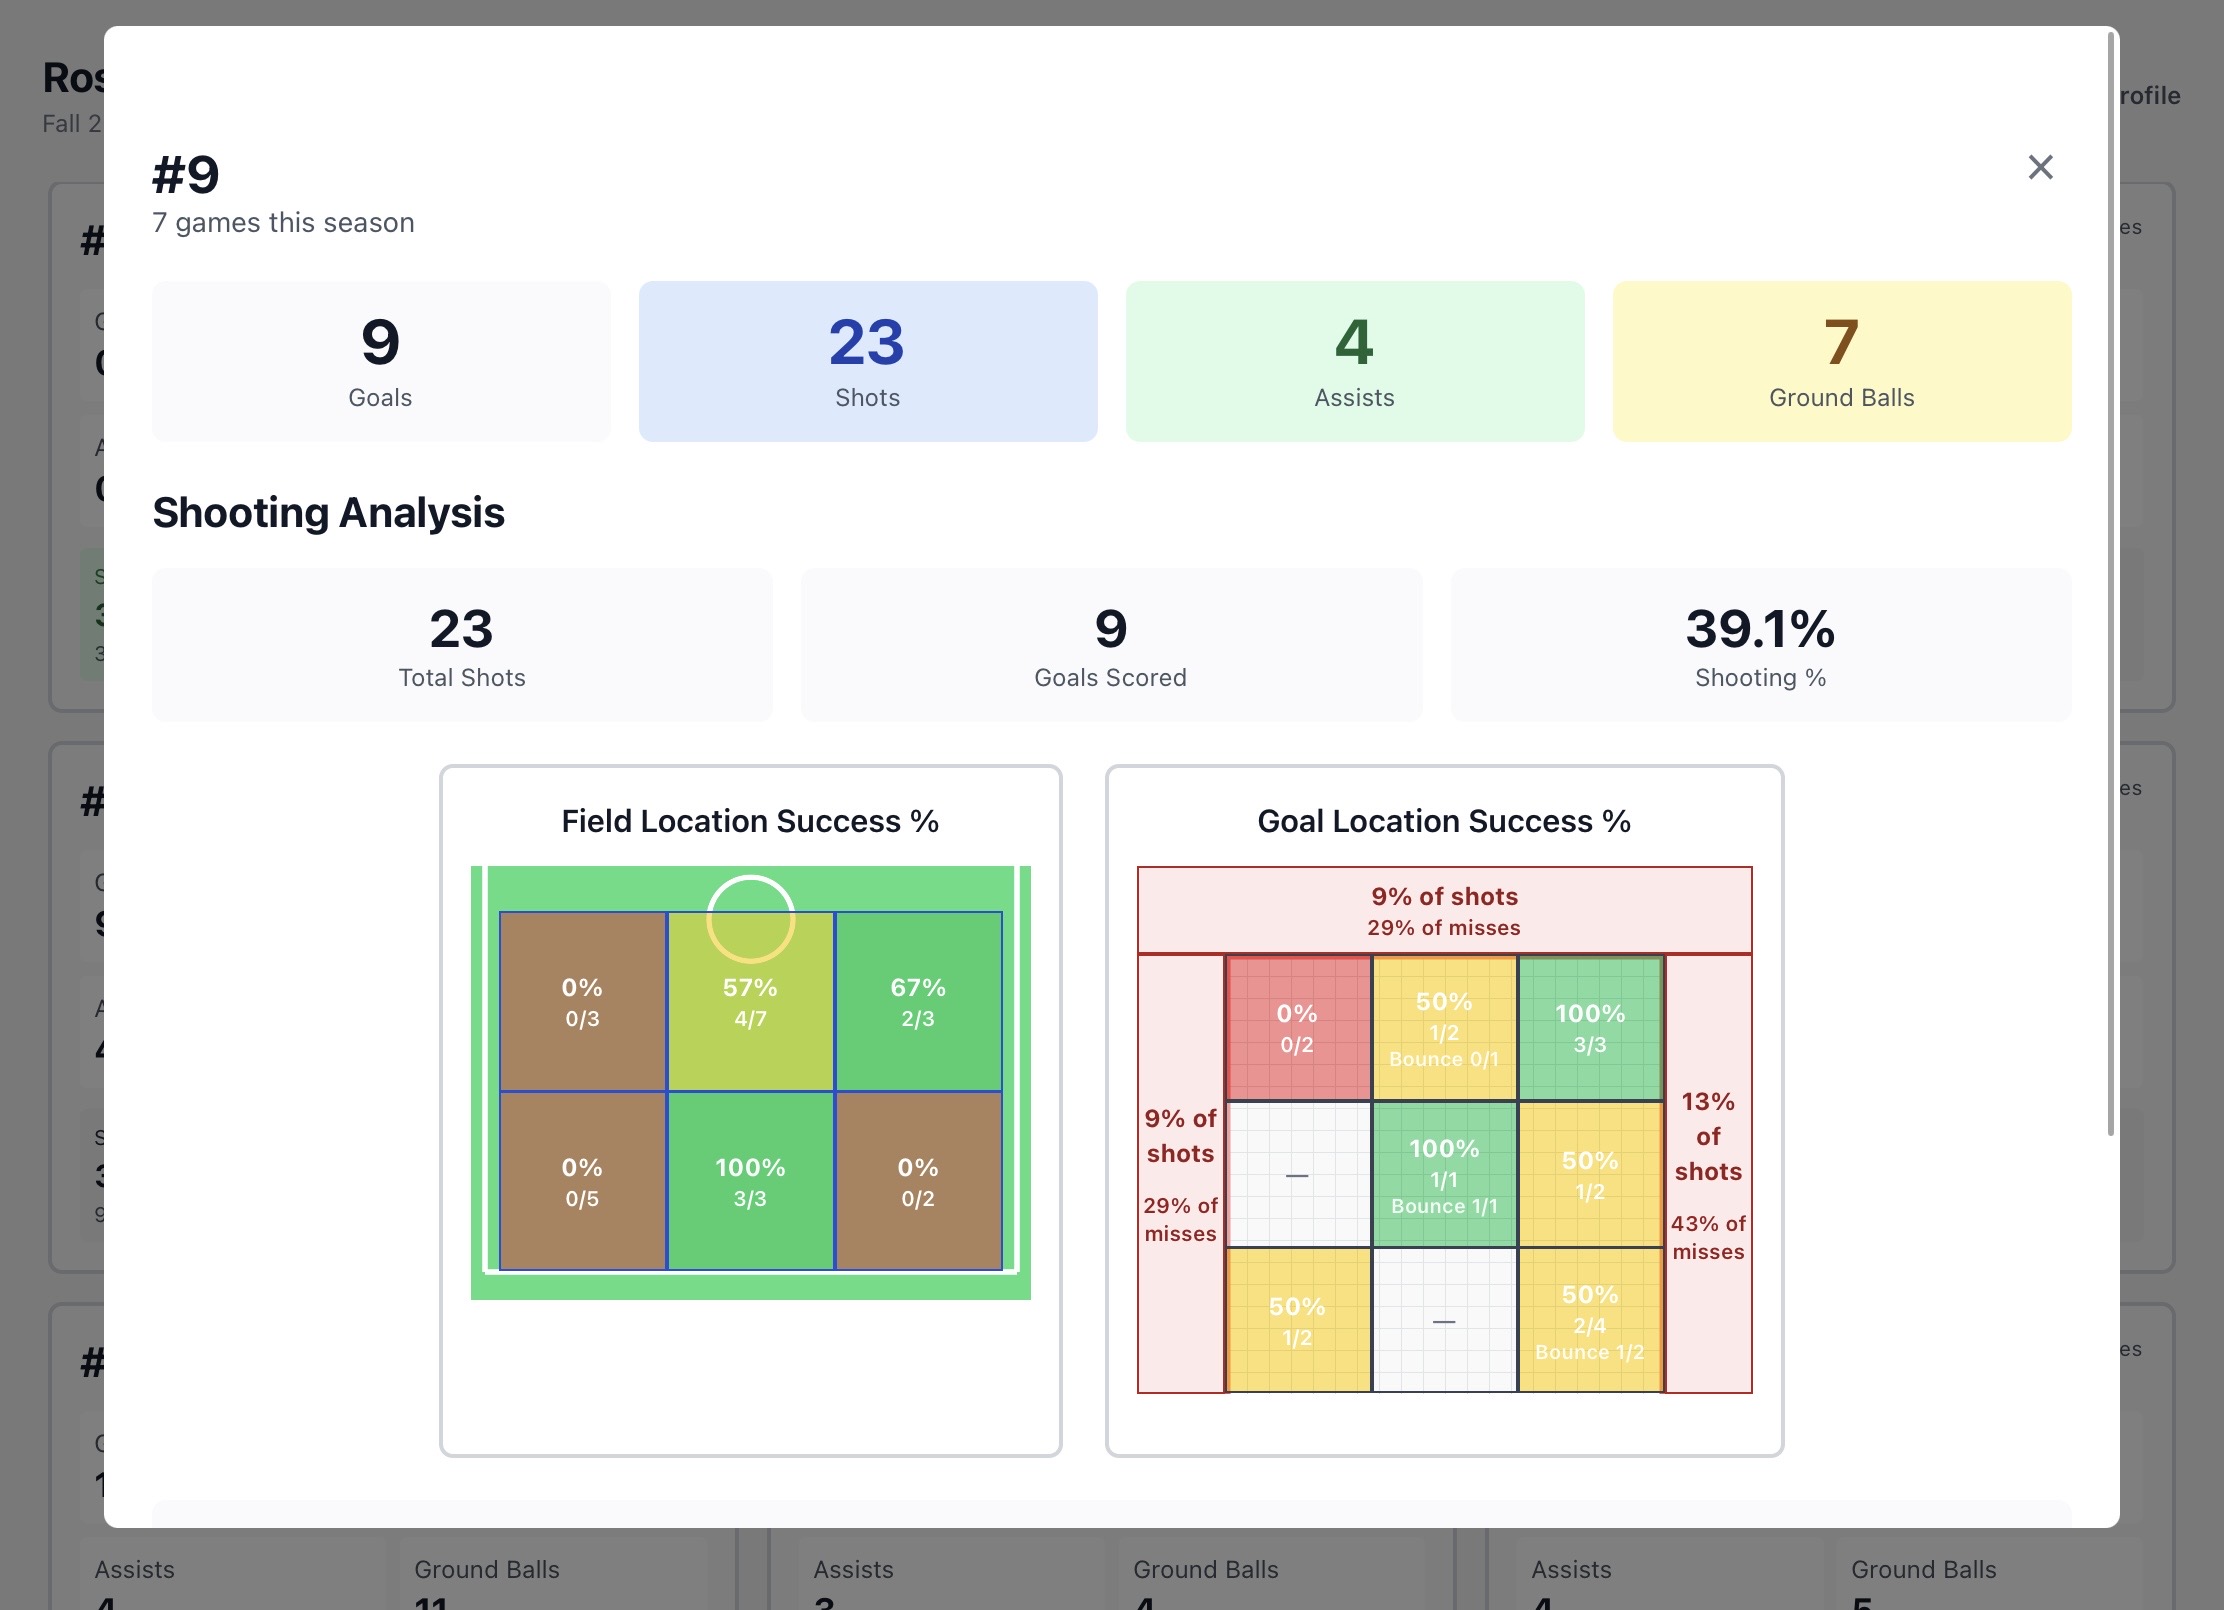
One game can be an outlier. A full season of shots plotted on the same map tells you what's actually true about your team — where you're winning, and where it's worth changing something.
Track goals, shots, assists, ground balls, faceoffs, saves, and penalties as they happen.
Percentage and exact-location views for both offense and defense, every game.
Team and player totals that build automatically as the season goes, no extra setup.
Go back and relive any game, any time — full box score, quarter-by-quarter visuals, and shot data for that specific matchup.
Track an opponent the same way you track your own team — where they're finding success, how they're doing it, and the tendencies that matter before you play them.
Track any number of games across a full event, no roster or season setup required, with results shareable to coaches, parents, and scouts through a public link.
CSV and PDF exports for any game, ready to hand off or keep for your records.
Tournament Mode is built differently from season tracking — no roster or season setup, made for covering a whole event's worth of games across any number of teams. Each bracket gets its own public link you can hand straight to coaches, parents, and scouts — no login required for them to see it.
Something we're actively building beyond what's available today.
Let anyone follow a game in progress from their own device — watch the score and stats update in real time without being the one entering them.
Have a question, or want to hear when it launches? Reach out any time.